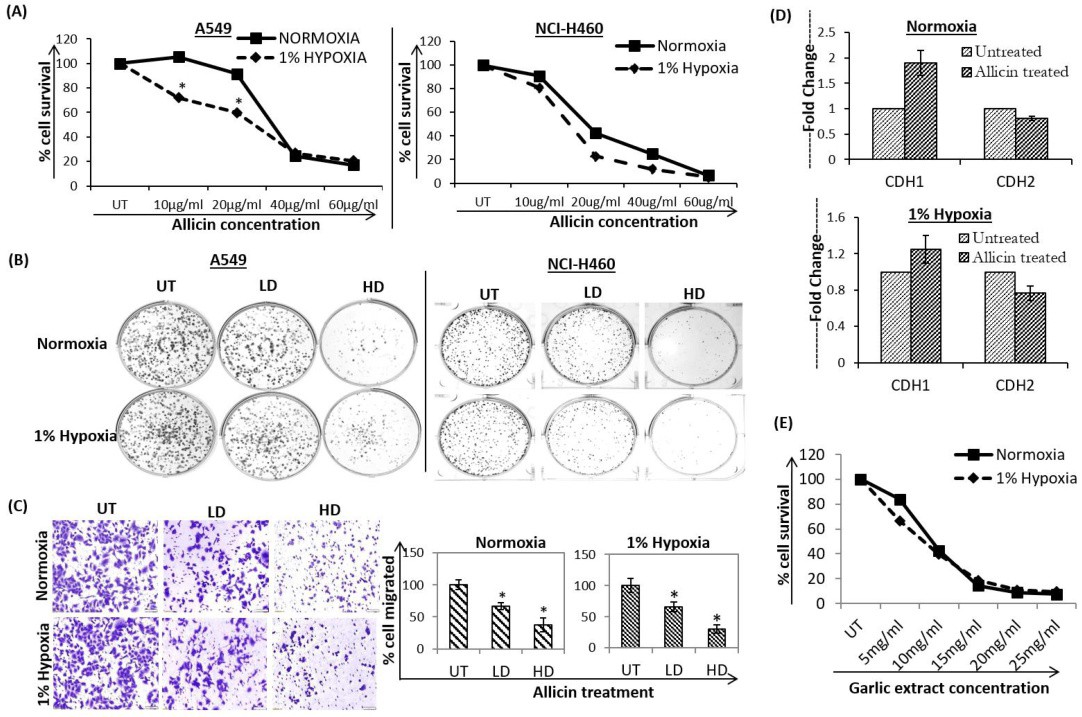
Fig. 1. Cytotoxic effect of allicin on NSCLC cells cultured in normoxia and 1% hypoxia. (A) A549 and NCI-H460 cells were treated with different concentrations of allicin (10-60 μg/ml) for 72hrs, and cell viability was assessed using the MTT assay. Data represent the mean of six technical replicate of three independent experiments. * represents p< 0.05 relative to its normoxic counterpart. (B) Clonogenic assay showing a significant inhibition of colony formation in low dose (LD) of 10μg/ml as well as high dose (HD) of 40μg/ml allicin treated samples compared to untreated (UT) sample in normoxia and 1% hypoxia. (C) Photomicrograph and plot representing percentage of A549 cell migrated in untreated and allicin treated conditions. The relative cell migrated (%) was assessed separately for normoxic and hypoxic condition by comparing the migration of allicin treated cells in normoxia/hypoxia with that of untreated control cells in normoxia/hypoxia respectively. The error bars indicate standard deviations. * represents p< 0.05 relative to its UT counterpart. (D) Real-time PCR of EMT markers in response to allicin (40μg/ml) treatment shows down-regulation of mesenchymal markers and up-regulation of epithelial marker in normoxic and hypoxic conditions. Results indicate fold change relative to untreated cells after normalization to the 18s expression. The bars represent the mean ± standard deviation calculated from three independent experimental values. CDH1= cadherin1/E-cadherin; CDH2= cadherin1/N-cadherin. (E) MTT Assay representing cytotoxic effect of garlic extract on A549 cells cultured in normoxia and 1% hypoxia for 72hr.